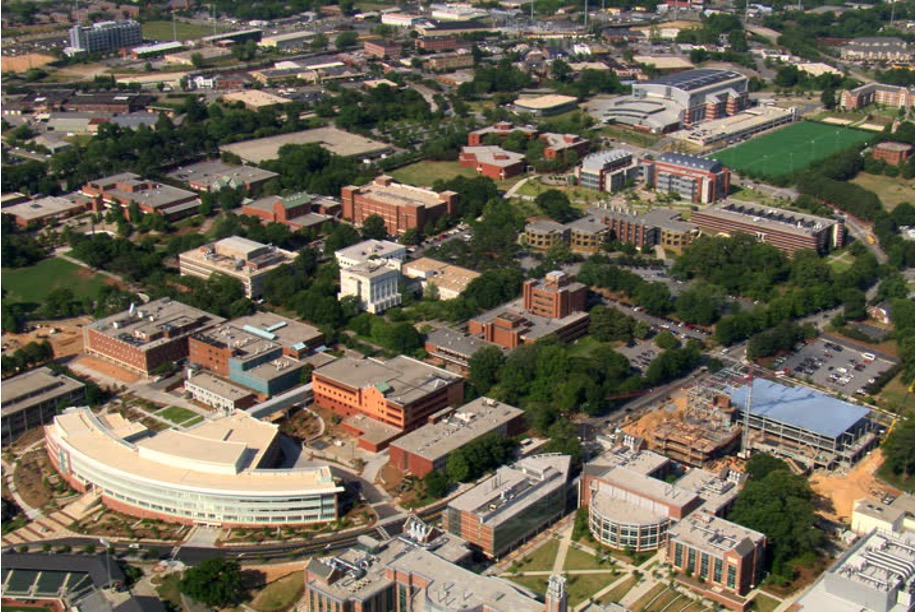
Smart Campus
Leveraging time-series data and the AVEVA PI system for a Smart Campus, Smart City, or Smart Center initiative is a powerful way to optimize energy usage, reduce costs, and make data-driven decisions
Here’s how you can use the data to achieve these goals, while also explaining some of the smart devices commonly used in these environments:
Data Collection and Smart Devices
Smart Meters: Smart utility meters measure energy consumption in real-time and provide data on electricity, gas, Chilled Water BTU, or water usage. Various Utility meters are the main key and the backbone for the data and analytics.
Environmental Sensors: These sensors monitor various environmental parameters like temperature, humidity, air quality, and occupancy. This is a big driver for WatchPost to be able to plan and forecast energy savings.
HVAC Systems: Building automation systems that use BACnet or Modbus for communication can provide data on heating, ventilation, and air conditioning (HVAC) performance. All the remote sensors that transmit data in a DCS/SCADA system are brought into a centralized PI server where analytics and visualization are achievable.
Lighting Systems: Smart lighting systems with sensors can offer data on lighting usage and occupancy. Sensor data for lighting can be used with WatchPost to validate if HVAC systems are running without the space being occupied.
Data Ingestion
Established set up data connectors are used to ingest data from these smart devices into the AVEVA PI system. Ensure compatibility with BACnet or Modbus protocols for seamless data integration.
Asset Framework Development
Implement an asset framework within the AVEVA PI system following the Haystack Schema (ASHRAE 223) to structure and organize data by building, system, or equipment type. This is ESSENTIAL if you are wanting both analytics AND visualization. This is what sets WatchPost apart from others!

Smart Meters
Measure energy consumption in real-time and provide data on electricity, gas, Chilled Water BTU, or water usage.
Analytics & Optimization
Apply predictive analytics algorithms to the time-series data to identify patterns, anomalies, and opportunities for energy optimization.
Custom Reporting
Create dashboards and reports that visualize energy consumption, cost savings, and the overall performance of the campus or center.
Data Preprocessing
Clean and preprocess the data to remove noise, fill gaps, and ensure data quality. This is for data quality issues when there is a gap in the meter data for a series of time. The value is considered invalid and and a calculated value is substituted.
Real-Time Monitoring
Use the AVEVA PI system to provide real-time monitoring of energy consumption, environmental conditions, and equipment performance. This is how we can analyze energy usage that is outside of expected values. For example simultaneous heating & cooling when not dehumidifying, too much outside intake, to much chilled water being generated, etc.
Predictive Analytics and Optimization
Apply predictive analytics algorithms to the time-series data to identify patterns, anomalies, and opportunities for energy optimization. Bringing in sensor date from HVAC, lighting and meters is the vital process to provide these analytics.
Develop algorithms that can predict and optimize energy consumption based on historical data, weather forecasts, and occupancy patterns is a feature that sets WatchPost apart in energy management platforms. With this data, you can effectively dispatch asset for campus demand needs rather than standard time of day scheduling. This is pivotal to limiting peak demand charges from utility companies resulting in energy bill savings.
Energy Management and Cost Savings
With insights from the AVEVA PI system and predictive algorithms, you can make data-driven decisions to optimize energy usage. For example, you can:
- Adjust HVAC settings based on occupancy and weather conditions to reduce energy consumption.
- Optimize lighting schedules to reduce electricity costs.
- Identify and address equipment inefficiencies and maintenance need proactively.
- Predict demand charges.
- Enhance customer comfort with Pre-Cooling/ Heating and coasting through afternoon costs of energy.
“The rise in Operational costs have triggered more opportunities to use data to predict Energy cost in assets usage for optimization. With the WatchPost Framework, we can utilize sensor data in real time and use predictive algorithms that reduce the cost of Energy while keeping assets online, reliable, and meeting campus demands.”
Reporting and Decision Support
Create dashboards and reports that visualize energy consumption, cost savings, and the overall performance of the campus or center.
- Empower stakeholders to make informed decisions on energy efficiency, maintenance, and asset management.
- Create routine cost and consumption reporting.
- Create monthly billing costs per the utility companies’ unit rates.
- Find facilities with High energy and determine a POA (Plan of Action) for mitigating.
- Help identify potential water or gas leaks to preserve facility integrity.
- Visualize your data on ESRI Geospatial maps in real-time.
- Mitigate potential restraint prior to affecting real-time operations.
- Contingency plan for operational challenges.
Continuous Improvement
Implement a continuous improvement cycle, using data to assess the impact of decisions and refine strategies over time.
Integration with Smart Grids
Explore integration with smart grids and demand response programs to further optimize energy usage and potentially earn incentives for demand-side management.
By effectively utilizing the AVEVA PI system and the data from smart devices, we can transform your campus, center, or site into a data-driven, energy-efficient environment. This approach not only saves money but also contributes to sustainability and environmental goals for net-zero carbon emissions.